Improving the Sensitivity of Gene Fusion Detection from Archer® FusionPlex® Panels
Posted on March 19, 2020

Recent studies point to promising new therapeutic options that can be applied in the presence of certain gene fusion events (such as NTRK gene fusions). Diagnostic labs can use RNA sequencing to detect such fusion events. The source material (e.g. tumor tissue) has to be prepared for sequencing using custom-made assays or using commercial assays such as Archer® FusionPlex®.
Given that we recently introduced a new module for detecting fusion events to our Seamless NGS software platform, we were interested in how sensitive our approach is on existing data. But how is it possible to assess the detection level for fusion events? Ideally, there should be an experiment where the fusion events are contained in varying, but previously known, concentrations. One elegant solution: a "dilution series" type of experiment where a solution with the element to study is diluted in another solution at different concentrations.
This is exactly what Dilon et al. did in their publication "Targeted RNA-sequencing for the quantification of measurable residual disease in acute myeloid leukemia". Amongst other things, they diluted ME-1 cell line samples into healthy adult donor peripheral blood mononuclear cells with dilution ratios from 1:10 to 1:100,000. The ME-1 samples contain a known CBFB-MYH11 gene fusion.
Analysis Results
We obtained the raw RNA sequencing data which the authors have shared on a public sequence database. We focused on the ME-1 dilution series that was prepared with the Archer® FusionPlex® Myeloid assay and sequenced with an Illumina miSeq machine.
We then used the new Seamless NGS RNA Fusion workflow to detect fusion events. The algorithm is not limited to known fusion partners or to specific breakpoint locations, enabling the discovery of entirely new fusions. For each fusion event, detailed information is provided that can be used to filter for custom requirements. Besides basic measurements like read support and the fusions probability of being a driver of the oncogenic process, the software provides information about whether or not the fusion is found in databases like TCGA, ChiTaRS. Also, known diseases associations and relevant literature is included. In addition, each fusion event is visualized connecting the gene annotation with the read coverage and the detected breakpoints:
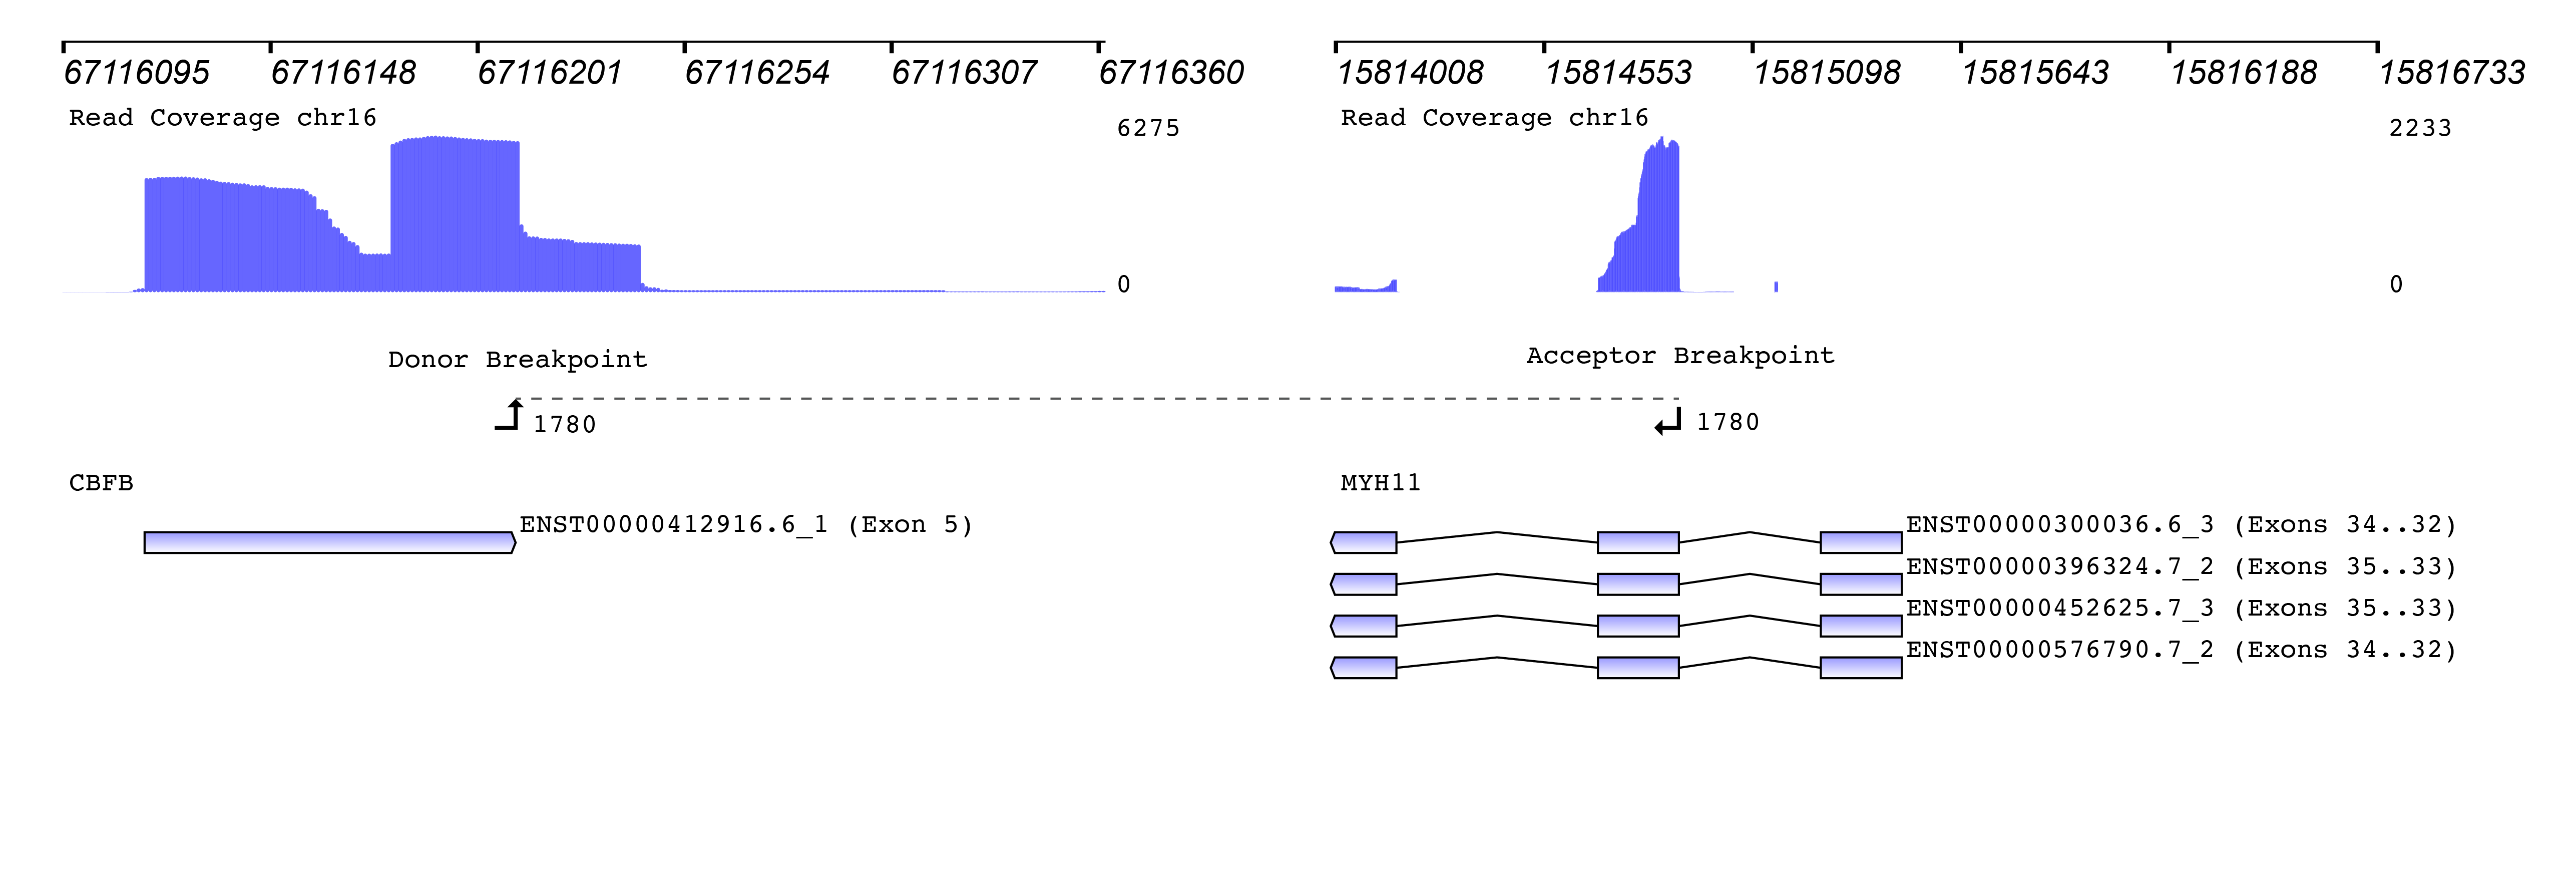
How to measure the abundance of a fusion? The original publication used the “percentage of unique reads spanning the breakpoint and supporting the event divided by the total reads at that locus” as a measure. Since “locus” was not clearly defined, we used a similar metric of “percentage of unique reads spanning the breakpoint and supporting the fusion event divided by the total number of reads at the breakpoint of the CBFB gene”.
The following plot shows these obtained percentages, first as shown in the publication (as computed by the original authors using the Archer® analysis software) and second with Seamless NGS.
| Cell Dilution | Orginal Study CBFB-MYH11 | Seamless NGS CBFB-MYH11 |
|---|---|---|
| 0 | 41.2% | 21.54% |
| 1:101 | 26.0% | 10.91% |
| 1:102 | 5.1% | 2.04% |
| 1:103 | 0.6% | 0.17% |
| 1:104 | Not detected | 0.01% |
Using the software provided with the Archer® assay, they were able to detect the CBFB-MYH11 fusion from dilutions of 1:10 to 1:1,000. However, our approach was able to detect the fusion in dilutions from 1:10 to 1:10,000. This means a 10-fold increased limit of detection for this fusion event.
An alternative way of measuring the abundance of a fusion is to normalize the support against a ubiquitously expressed gene, allowing a comparison between different samples and fusions. The authors are plotting the ratio of target copies/ABL1 copies (log10) against the cell dilution (−log10). They do this both for their custom assay (NIH AML MRD RNA-Seq) (blue) and the Archer® FusionPlex® Myeloid assay (red).
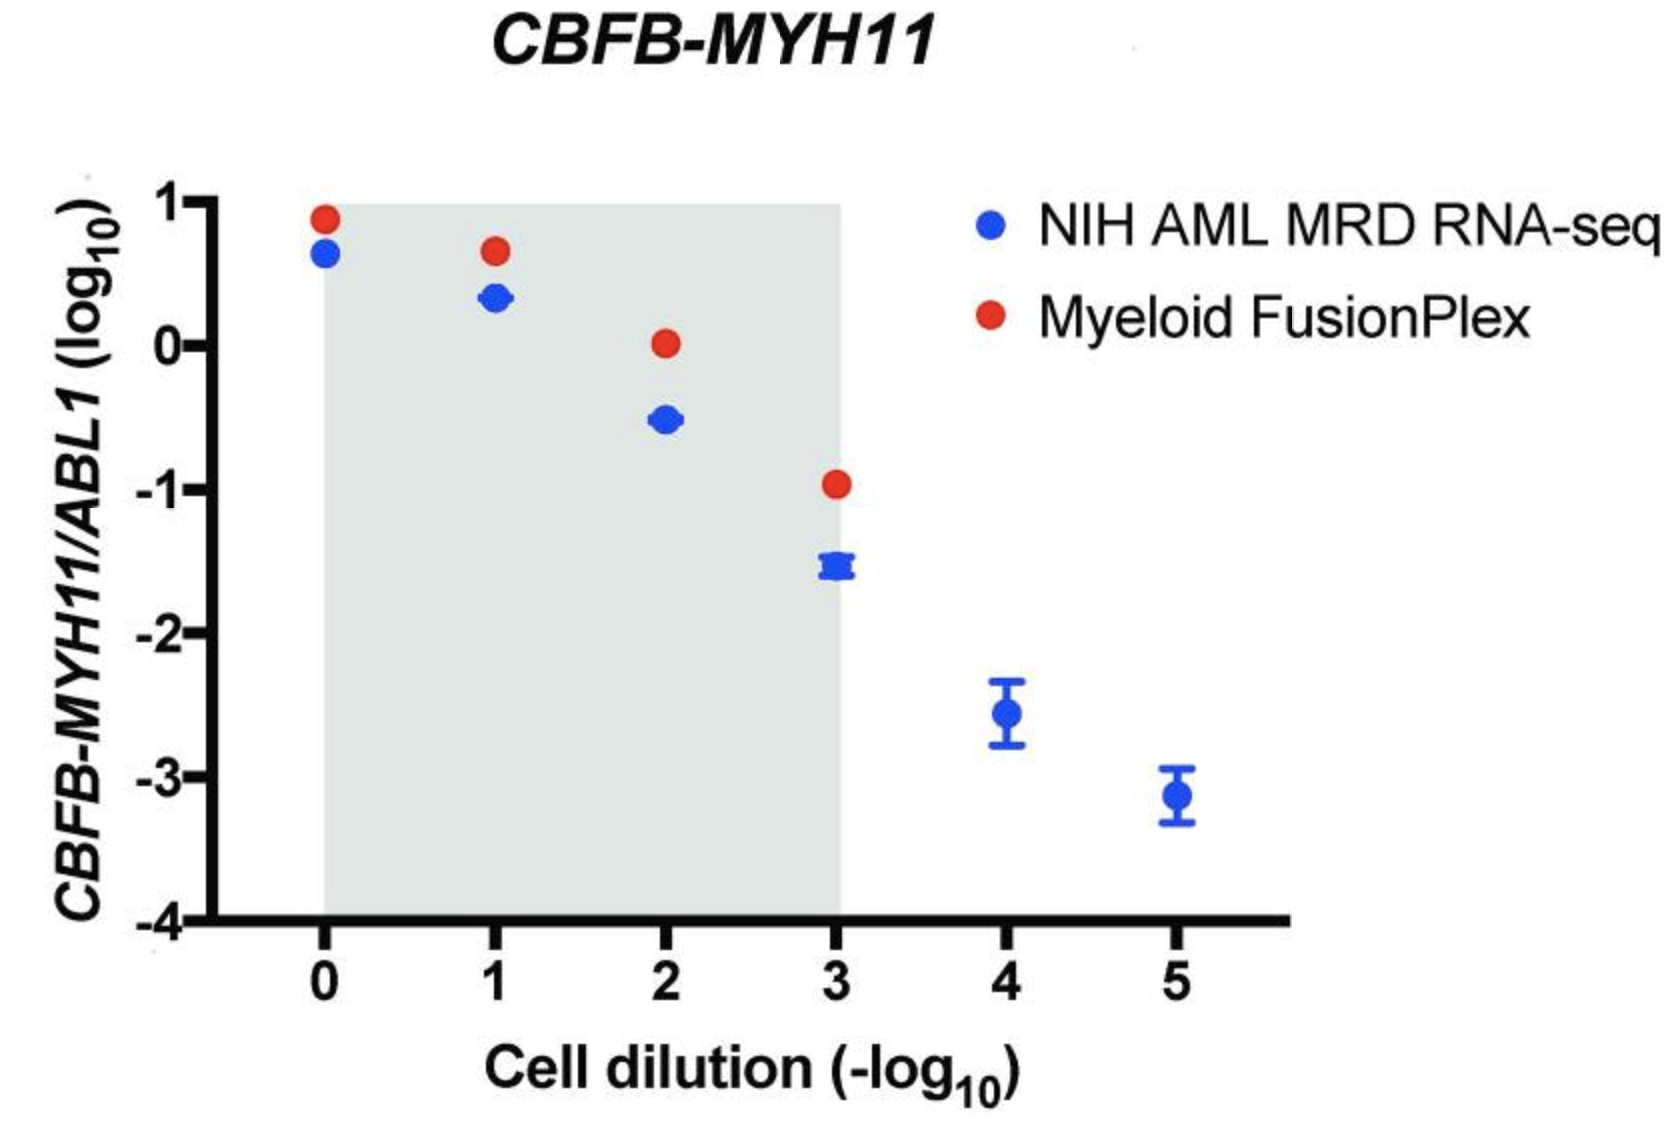
The grey area indicates the cell dilution frequencies in which the mutation could be detected by both methodologies. Note that dilution level 1:105 was not assessed with the FusionPlex assay. When we visualize the results of Seamless NGS similarly, we obtain the following plot:
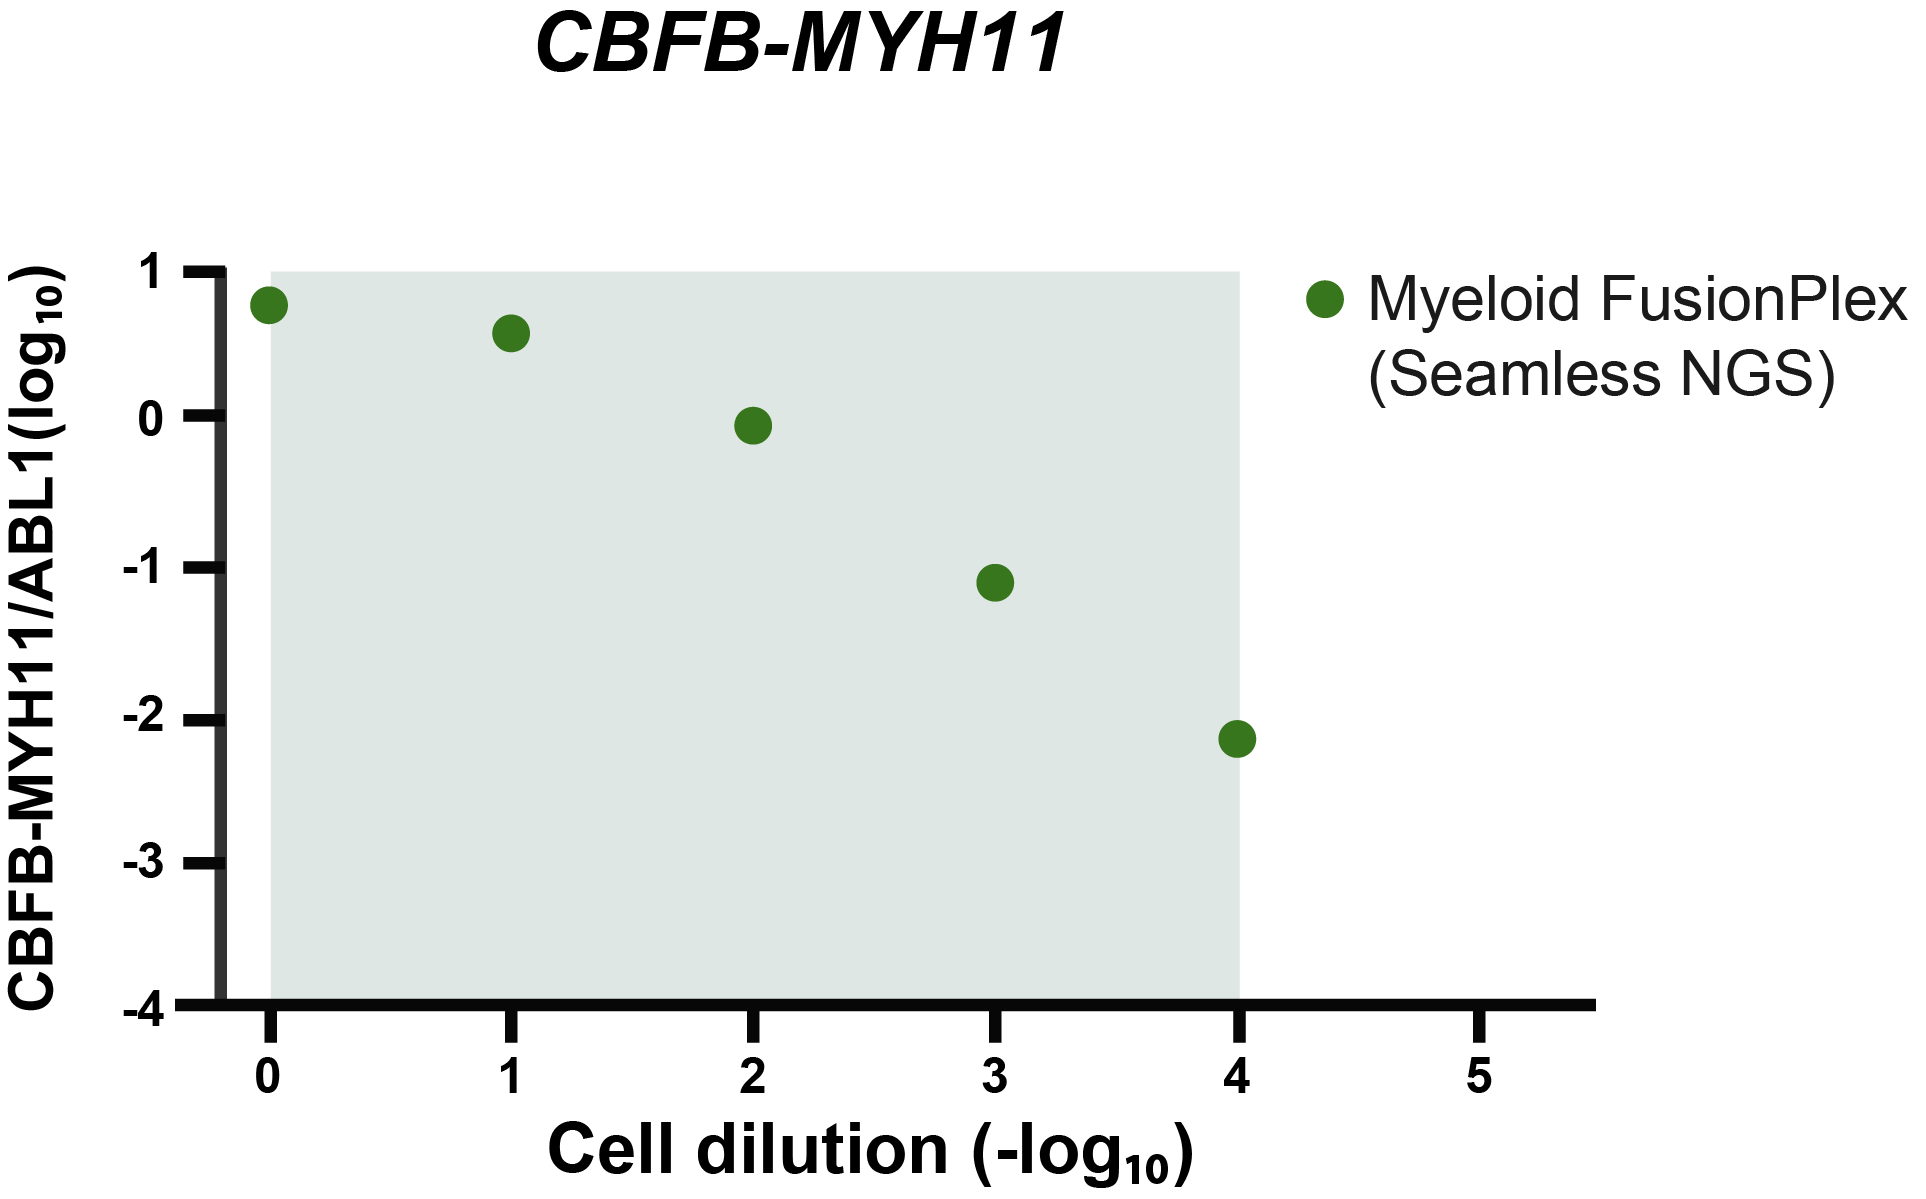
Again, we see that the abundance of fusion is linearly decreasing with the known dilution of the ME-1 cell lines. As indicated by the gray area, Seamless NGS can detect the CBFB-MYH11 fusion in the Archer® FusionPlex® Myeloid data down to a dilution of 1:104, whereas previous analysis methods from the same data allowed only detection levels of 1:103.
Summary
Fusion analysis with RNA sequencing offers great flexibility and sensitivity for detecting multiple molecular targets in a single assay. Comparing our results with previous results, we were happy to see that Seamless NGS did not only match the sensitivity of the Archer® software but surpasses it by one order of magnitude. This opens up new possibilities for users who would like a software that can flexibly analyze a range of RNA fusion assays from different vendors (Archer®, QiaSeq®, Illumina®, …) without sacrificing accuracy or convenience.
About Seamless NGS

Seamless NGS is a software platform for automated analysis and management of next-generation sequencing experiments. It provides easy access to advanced bioinformatics protocols for the detection of SNVs, InDels, Copy Number Variants and RNA Fusions. Seamless covers the complete genetic testing workflow from raw NGS data analysis to interpretation. Its private computing platform leaves any genetic customer data in-house, permitting GDPR compliance and full data control.