Whole-Exome Analysis on a Mainstream Desktop PC
Posted on September 12, 2020

Analysing NGS data usually is the domain of power compute servers or High-Performance Clusters, as it typically has massive volume and requires a lot of data crunching. However, the power of available CPUs is increasing, and now there are faster processors with more cores available on the market at competitive prices. This applies not only to the sector of the server “workhorses” but also to the sector of “standard” Desktop PCs. This sector is characterized by commodity hardware that is produced in high volumes and can be bought at affordable prices. While this kind of PC used to have just a single core, it is today possible to buy Desktop CPUs with as many as 16 cores.
Given the price premium that is necessary to enter the high-performance server sector, the question arises: why not use commodity hardware for NGS data analysis? So we started an experiment: how feasible is it to do a resource-intensive whole-exome sequencing (WES) analysis on a modern Desktop PC.
Hardware setup for WES analysis
We went on to assemble a suitable new computer with current hardware. We went for a 12-core AMD Ryzen 3900X CPU. This processor was released in 2019 and offers great performance. We then included 32 GB of RAM as well as a fast M2 SSD hard drive to make it suitable for the computation of NGS data. The total costs of this system were less than 1500 Euro.
We compare this to our 5-year old HPC unit that boasted an Intel Xeon processor with a total of 40 CPU cores. More CPU cores means that more computations can be conducted in parallel. The analysis will be much faster as long as the software is able to effectively make use of this parallelization. The HPC unit contained a RAID storage system with around 40 TB hard drives. At the time of buying this system had a price tag of around 12.000 Euro. So this is 800% the price of our new system.
As example data we took a full sequencing run of an Illumina NextSeq 500 that contained 16 whole-exome samples. Each was sequenced to an expected ~60x coverage using a Twist Bioscience Human Exome Kit with a target size of 36 Megabases. The sequencing run has a total sequencing depth of 100.4 Gigabases.
We analysed this data using the Seamless NGS software. Since our focus is to assess the performance gains due to hardware, not due to software, we used a (moderately optimized) standard analysis workflow relying on widely used NGS tools (e.g. BWA alignment). We previously confirmed that this approach for DNA variant detection meets our expectations regarding sensitivity (>0.99), specificity (>0.98) and reproducibility. Our analysis includes all auxiliary steps such as preprocessing, quality control and DNA variant annotation. Even though it is possible to perform Copy-Number Variation (CNV) analysis with Seamless NGS, it was excluded from the runtime analysis.
We were also interested whether there is a significant difference in the runtime between Linux and Windows, so we installed both operating systems on the new computer. Seamless NGS runs on both of these, so we could use that for comparison. For technical reasons we could not install Windows on our HPC.
What were our initial expectations before running the experiment? Our HPC unit is quite powerful. With 12 vs 40 CPU cores, it has more than 3 times as many physical processors available for challenging computations. On the other hand we have seen considerable improvements of computer hardware in the last years, including the availability of affordable SSD drives as well as the release of new processors with higher per-core performance. So we think that it is entirely possible that the NGS analysis performance of the new system is on par with our HPC unit.
WES runtime comparison results
Before looking at the performance of the different systems, we need to establish that we obtain comparable analysis results in all the test cases. To this end, we compare several important QC measures - the number of detected variants, alignment rate, mean coverage - across the different systems. We find that these numbers are absolutely identical - so we can go on.
Let us first look at the runtime on the High-Performance Cluster (on Linux). We will visualize the time required for the analysis separated by individual analysis steps. We here omit small steps that take only a few seconds and also group these steps into broader categories (e.g. Quality Control) for good oversight. Let’s take a look at the resulting Gantt chart:
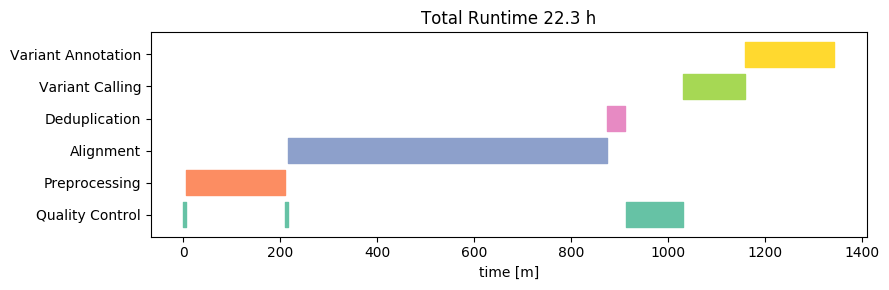
The total runtime is about 21 hours - this is slightly below 2 hours per sample. This is not a bad time, considering that all necessary steps (including annotation) are already included in this analysis. Most of that time is spent with the alignment, variant calling and preprocessing raw reads.
Next, let's take a look at the runtime of the same analysis on our new 1500-Euro computer, running Linux:
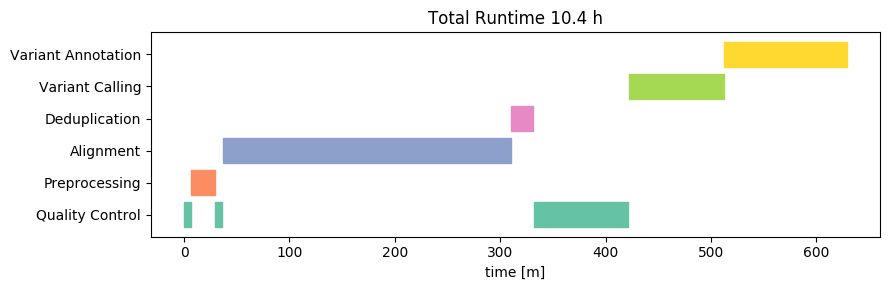
Wow! The total runtime on this is about 10h, or about 50 minutes per sample. This result beat our wildest expectations. Yes, we expected that hardware improvements would lead to a strong improvement on a per-core basis. After all, hardware manufacturers are constantly innovating and competing hard over every performance gain. We did not expect that the 12-cores would in fact beat the 38-core HPC by THAT much. From this cursory analysis it is not entirely clear to us what factor(s) are responsible for these performance gains, but likely it will be a combination of increased CPU speeds, CPU processing efficiency, storage speed and mainboard bus throughput.
Now let’s take a look on what happens when we use the same machine, with the same data and analysis, but switch the operating system from Linux to Windows 10:
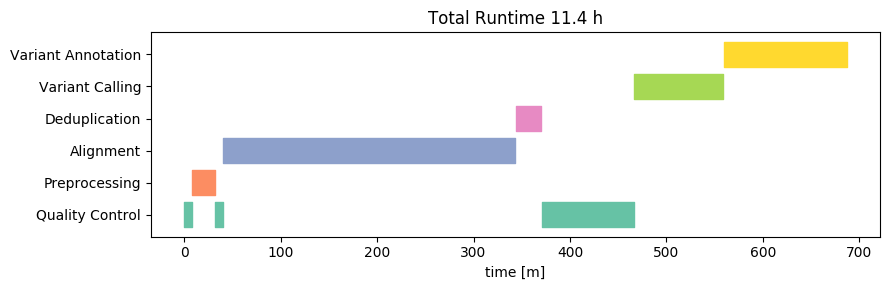
In this case, the runtime is slightly higher on Windows compared to that on Linux on the same machine. The difference however is not substantial - each sample takes about 55 minutes. Most of the difference takes place in the alignment step.
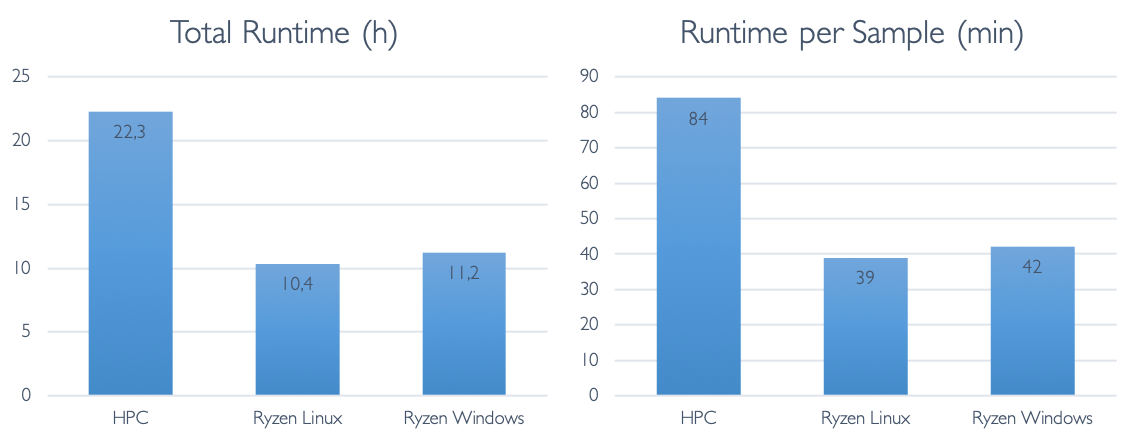
Finally, let us look at the total runtime differences:
Outlook
Are there faster ways to analyse Whole-Exomes, Whole-Genomes or Clinical Exomes? Absolutely. You could replace standard tools with high-performant software more suited to the specific data. You could employ dedicated computer hardware such as Field Programmable Gate Arrays (FPGAs) or Graphical Processing Units (GPUs). In fact, it is possible to purchase commercial systems that combine some of these techniques to bring down the computation time to as low as 8 minutes per exome from reads to DNA variants. However, the goal of this post was a different one: to show how far you can go today without a big investment.
The results of our test really surprised us: it is possible to easily analyse two NextSeq 500 runs comprising 24 Whole Exomes in a single day on a ‘normal’ Desktop PC. This means that even such a low-cost system is able to analyse more than 8000 exomes per year! We expect that with a bit more optimization, significantly higher numbers will be possible - on a single machine. Most software tools will also allow you to combine several machines. Does this mean it is time to rethink the hardware requirements needed for NGS data analysis, including Whole-Exome Sequencing?
About Seamless NGS
Seamless NGS is a software platform for automated analysis and management of next-generation sequencing experiments. It provides easy access to advanced bioinformatics protocols for the detection of SNVs, InDels, Copy Number Variants and RNA Fusions. Seamless covers the complete genetic testing workflow from raw NGS data analysis to interpretation. Its private computing platform permits hassle-free GDPR compliance and full data control.