How are base qualities calculated and stored?
No sequencing platform is perfect and this holds good for Illumina machines. An elementary but not excludable error occurs during the sequencing process when the machine tries to infer a base from each measured light signal (see 2/4-channel System). For the base calling, the strength of the light signal, the appearance of the light spot and other characteristic features are measured and interpreted by the base caller software. Errors at this step are very relevant because they influence your sequence data directly and make them less reliable. For this reason it is essential to know the probability of such errors and how to handle them.
Where do the errors come from?
The reasons for errors during the base calling process are diverse. In most cases the emitted light signal of a cluster is disturbed. In this context, it is important to know that the detected light signal is always a sum of single signals from thousands of molecules within one cluster. Typical reasons for a polluted cluster light signal can be phasing (see quality decrease over illumina reads), overlapping clusters and not uniform clusters because of an error in the cluster generation (bridge amplification) step. Because the probability of errors fluctuates and differs from cluster to cluster and from cycle to cycle it is necessary and useful to indicate a quality for each called and recorded base expressed in a score.
How a quality score is born
Illumina systems create a quality score in three steps. First of all it evaluates the detected light signal for each base call for every cluster, on every tile, for every sequencing cycle simultaneous with a sequencing run. Thereby it measures various aspects correlating with the quality of the base call like single-to-noise ration and light intensity (1). Based on these parameters a quality predictor value (QPV) is calculated. In the second step the QPV has to be translated into a quality score with the help of a quality table. The Q-table based on a statistical calibration curve derived from empirical data including various well-characterized human and not-human samples mostly using a version of the so-called Phred algorithm (1). That is why the score is also called Phred quality score. In the last step the quality score (per cycle) is recorded common with the base call in a base call file (.bcl) which is later converted to FASTQ files (.fastq). If you take a look in such a FASTQ file you can see a quality score code line belonging to each base call line (Fig. 1). Thereby the quality score is transferred into a single letter code to reduce the file size.
@SRR357068.1 D042KACXX:3:1101:2690:2160 length=101
NCATCGTCCGGTATGTAGAACAGGGGAACCGGACGTTTTCCAAGGCGTAGCCATGTTAGACAAGGCGCAGATATAGGTGA
+SRR357068.1 D042KACXX:3:1101:2690:2160 length=101
#4=DBDDDHFHFFHIGHIIIJJJJJJJJJJJJBHDAGHJGGGHIJHFFFFDDEDCCDCCCCDDDDDBDBD>CDEE>C@CD
Figure 1: Quality values (4th line) in FASTQ format. The number of quality values is equal to the number of bases in the read (one quality per base).
Why are sequence qualities stored in phred score, and what does the phred score mean?
Now you know how a quality score is created. But how can you use these values and what do they tell you? In simple words a quality score can be interpreted as a error probability belonging to each base. In mathematical words quality scores are defined as a property that is logarithmically related to the base calling error probabilities (P)2. Q = − 10 log10 P (2). An example will shows you the meaning. A base call with a quality score of Q40 means one base call in 10,000 is predicted to be incorrect. For base calls with a quality score of Q30, one base call in 1,000 is predicted to be incorrect meaning a base call accuracy of 99,9% (2). The interpreting is also shown in tab. 1.
| Phred Quality Score | Probability of Incorrect Base Call | Base Call Accuracy |
|---|---|---|
| 10 | 1 in 10 | 90% |
| 20 | 1 in 100 | 99% |
| 30 | 1 in 1,000 | 99.9% |
| 40 | 1 in 10,000 | 99.99% |
| 50 | 1 in 100,000 | 99.999% |
Table 1: Quality scores and base calling accuracy (2)
Normally you want to see the change of the base quality with rising cycle number for a read. For this analysis programs like FastQC take the data from FASTQ files and transform it into a base quality diagram shown in Fig. 2. You can find more information in this article.
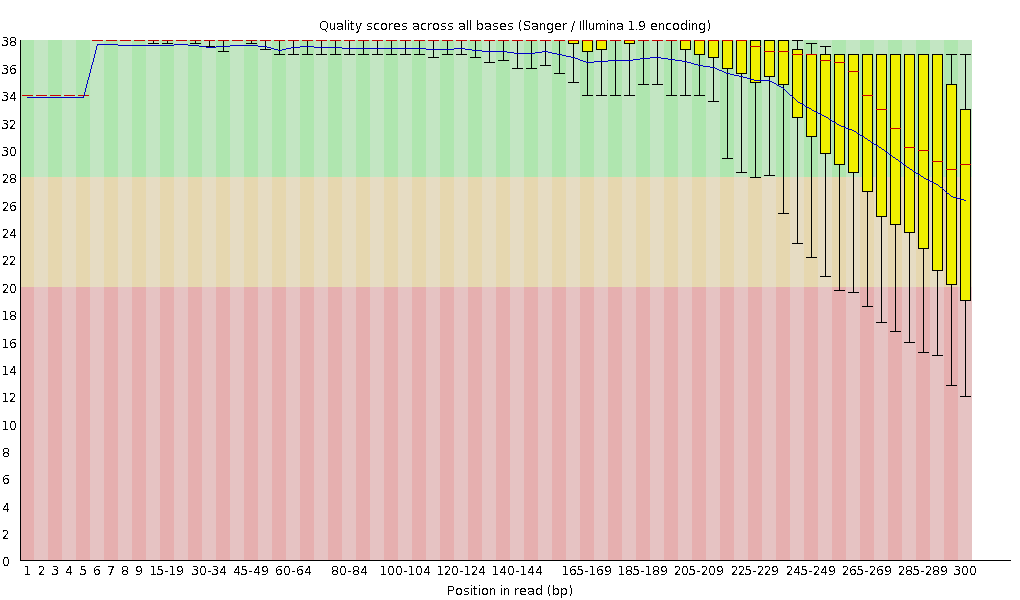 Figure 2: Per base sequence quality control.
This article should give you an understanding of the importance and use of the quality score. It is an essential value for checking the reliability of your sequencing data and enables you to handle with it in a more confident way.
References:
- Illumina: Understanding Illumina Quality Scores (Retrieved 2017-01-03)
- Illumina: Quality Scores for Next-Generation Sequencing (Retrieved 2017-01-03)
Would you like to sharpen your NGS data analysis skills?
Join one of our public workshops!About us
ecSeq is a bioinformatics solution provider with solid expertise in the analysis of high-throughput sequencing data. We can help you to get the most out of your sequencing experiments by developing data analysis strategies and expert consulting. We organize public workshops and conduct on-site trainings on NGS data analysis.
Last updated on February 28, 2018