How to calculate the coverage for a NGS experiment
When you work with NGS there is one term that is used particularly often: coverage. Sometimes it is a little bit difficult to deal with it, because aside to the common definition there are alternative descriptions, various types (including various forms of calculation) and confusion with another term: the sequencing depth.
What does coverage mean in the context of NGS?
The term “coverage” in NGS always describes a relation between sequence reads and a reference (e.g. a whole genome or al locus), unlike sequencing depth which describes a total read number (Fig. 1). It is very important to distinguish between them:
- Coverage in terms of redundancy: number of reads that align to, or "cover," a known reference. It describes how often, in average, a reference sequence is covered by bases from the reads. This is an important information because multiple observations per base are needed to obtain to a reliable call (1). Therefore coverage is also used as a unit for the statistical power of sequencing data. Depending on the reference, there are different ways to calculate this coverage which are shown below.
- Coverage in terms of the percentage coverage of a reference by reads. E.g. if 90% of a reference is covered by reads (and 10% not) it is a 90% coverage. This form of coverage can be interesting if parts of the donor DNA cannot be sequenced at all.
- Sequencing depth: total number of usable reads from the sequencing machine (usually used in the unit “number of reads” (in millions). Especially used for RNA-seq.
 Figure 1: Distinction between coverage in terms of redundancy (A), percentage of coverage (B) and sequencing depth (C). 1) Sequenced bases is the number of reads x read length
Coverage and its references
There are different possible reference points for the coverage leading to three different coverage types. Thereby the coverage can refer the whole genome, one locus (in the genome) or one (nucleotide-) position (see Fig. 2).
 Figure 2: Different possible reference points for the coverage
| Reference point | Calculation | Example (see Fig.2) |
|---|---|---|
| Whole genome | (# of sequenced bases)* / (genome size) | 188 / 112 = 1,68 fold |
| One locus | (# of bases mapping to the locus) / (size of locus) | 188 / 46 = 4,09 fold |
| One position | (# of reads overlapping with one position) | 6 fold |
Example for computing sequencing coverage
Here is an example for whole genome sequencing: What coverage of a human genome will one get with one lane of a HiSeq 2000 in paired-end mode (2 x 100), if 200 M clusters were bound?
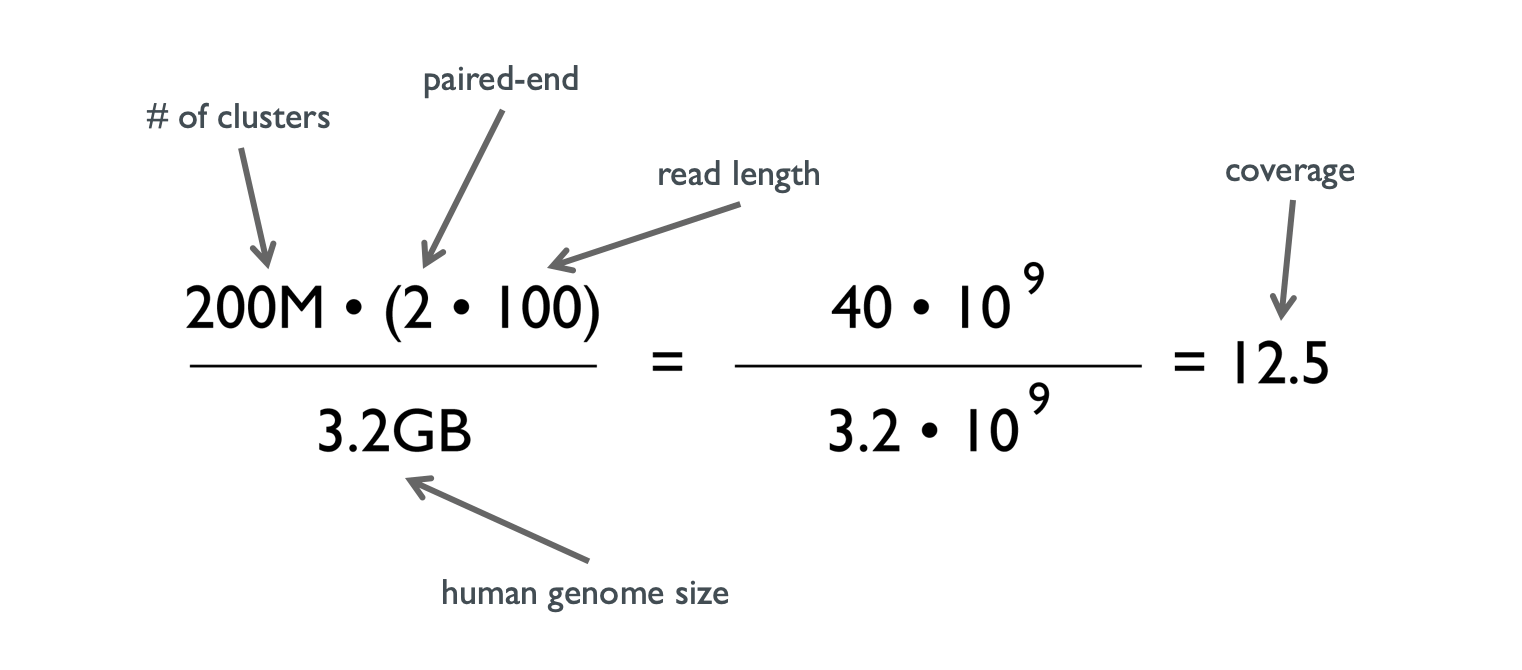 Figure 3: Example coverage calculation
In this case “paired-end” doubles the read length because each fragment is sequenced from both sides. The number of sequenced bases can also be computed by the number of reads x read length.
It should be noted that the computed average is a theoretical unit. Reads are not distributed evenly over an entire genome (see our article about uncovered genomic regions). That is an important fact especially for whole genome sequencing. Therefore many bases will be covered by fewer reads than the average coverage, while other bases will be covered by much more reads than average.
What is a good coverage for an NGS project?
There is no general guideline for determining the optimal coverage for a sequencing project. It highly depends on the type of experiment, the species, the input material, the sequencing platform and other factors. Illumina, for example, provides on their website the possibility to search for publications with similar experiments so you can use these as pointers for your project, and also a Sequencing Coverage Calculator [3]. However, we strongly suggest to consult your bioinformatics or sequencing service vendor for this question before ordering the project, so you can build on existing experience.
- "Sequencing Coverage". illumina.com. Illumina education. Retrieved 2017-10-02.
- Lander ES, Waterman MS.(1988) Genomic mapping by fingerprinting random clones: a mathematical analysis, Genomics 2(3): 231-239.
- http://support.illumina.com/downloads/sequencing_coverage_calculator.html (Retrieved 2017-15-02)
Would you like to sharpen your NGS data analysis skills?
Join one of our public workshops!About us
ecSeq is a bioinformatics solution provider with solid expertise in the analysis of high-throughput sequencing data. We can help you to get the most out of your sequencing experiments by developing data analysis strategies and expert consulting. We organize public workshops and conduct on-site trainings on NGS data analysis.
Last updated on May 11, 2019