Inspecting Consumer Whole-Genome Sequencing Data
Posted on June 15, 2023
As a provider of software, services and training in the area of next generation sequencing (NGS) bioinformatics, we naturally see a lot of sequencing data. The “end users” of our analysis results are typically life science researchers, or biotech- or medical professionals. Recently, a new breed of companies started offering comprehensive DNA sequencing for consumers. For example, they might offer Whole-Genome-Sequencing (WGS), at a reasonable level of coverage, together with a set of potentially interesting analyses, all at an incredibly low price of $300. Therefore, we could not resist the temptation and ordered such a test with the overall goal of checking the amount and quality of data obtained.
What you receive
We decided to order a DNA test from Nebula Genomics, which is one of the largest providers that also offers downloading of the genomic data. After sending back the cheek swab, we had to wait for several weeks until the results were in. You are now able to inspect a range of reports about your genetic traits (simple and complex), ancestry, oral microbiome and genetic variation. A deep-dive discussion of these reports is a little out of scope for what we want to do here, and can be found elsewhere already. Of more immediate interest to us is the raw data itself, which underpins all downstream analysis. We directly went on to the data download section, and were positively surprised about the specific files offered for download. Before ordering, we checked the FAQ, which stated that we will be able to download all data in “BAM format” and “VCF format”, both important for describing sequence alignment characteristics and genetic variant information, respectively. Since BAM files contain alignments to the human reference genome, it was not clear from the FAQ however if the full dataset - including also sequences not aligning to the reference - would be provided.
We now found that we were able to download:
- two FASTQ files, containing the all raw sequence reads
- a CRAM file, containing the alignments to the reference genome in a highly compressed file format (but with the same information as in a BAM file)
- a VCF file, containing the detected DNA variants
- Corresponding index files for the CRAM and VCF files which are helpful to increase the performance when working with alignments and variants, respectively
In other words, we are given the complete data in standardized file formats.
It’s worth noting that Nebula Genomics does not provide any QC reports alongside this data. In order to assess the provided data we must analyze it ourselves. So, the following visualizations were created with our own Seamless NGS software and open source tools. Nebula Genomics also does not provide a description of their data analysis workflow, so we will have to reverse engineer some of this information based on the files provided.
Quantity and quality of raw sequencing data
We first looked at the raw sequencing data from the provided FASTQ files:
- Sequences : 2x 382,683,421
- Sequence length: 150 bp
- Total data: 2x 57,4 Gbp
- File sizes: 2x 52 GiB
The distribution of base qualities is usually one of the most important quality metrics to look at:
We can observe that the medium base quality for all positions in the read sequence averages to a median of 36 (Phred score). When we average the quality for all bases in the read, we see that most sequences have a mean quality score of 37, while some even go up to 39. This amounts to a very good quality by today's standards. According to their FAQ, they employ the MGI DNBSEQ-T7 sequencing machine. Most data from the market leading Illumina sequencing machines will report base qualities that top at 36. Does that mean that the quality here is better than from those common Illumina machines? Not really, since the quality scores reported are essentially estimated by an internal software that has been calibrated by the vendor and any comparison between different sequencing machines should not be based on these numbers. More in-depth studies (e.g. Hak-Min Kim et al) suggest that the raw sequence quality is roughly comparable between those most common platforms. What this means however is that the sequencing laboratory did a good job in operating the sequencing machine.
Alignments
Nebula genomics provides a CRAM file containing the sequences aligned to a reference genome. Let us first find out what tool they used for this step, and what reference. Luckily, the CRAM file itself contains this information: they used the alignment tool minimap2. This is a bit unusual in that bwa-mem is the more widely-used tool, despite being its predecessor, and also the standard tool recommended for the variant analysis pipeline employed later on. However, for most data minimap2 has been shown to provide similar accuracy for variant detection while providing a significant runtime speedup compared to bwa-mem. The output format is quite similar. With the expectation that MGI made some internal tests for how well it works for the MGI DNBSEQ-T7 sequences, this tool is a sensible choice given that they have to handle high data volumes.
The CRAM file also reveals some information regarding what reference genome they have been using. This can be reverse-engineered based on the names and checksums of the chromosomes, for example. This reference version information is of great importance, because if we aim to do any additional analysis using the result files provided by Nebula Genomics Inc., we need to ensure that the same reference genome is used. The reference genome turns out to be a modified version of the Genome Reference Consortium Human Build 38 (GRCh38) using UCSC nomenclature. All information points to the fact that they used Verily's GRCh38 genome, but when comparing it to the downloadable version we found that there are some mismatches in sequence checksums. We asked Nebula for the precise reference genome, but unfortunately they did not provide any answer.
We could however infer that the reference is based on the so-called “analysis set” of hg38. The hg38 contains several features that complicate data analysis (find some details here), and these special versions of the GRCh38 reference genome facilitate a correct use of common read mapping tools with hg38. Notably, the names and coordinates of the 23 chromosomes are the same as the UCSC hg38 assembly, meaning that you should be able to use the VCF file with any hg38-based analysis.
Let’s take a brief look at the alignment statistics:
As expected, most of the reads - 99,4 % to be precise - could be aligned successfully to the human reference genome. This is a very good number, and it means that there was no major contamination of the sample which can happen, for example if you have a viral infection while taking the mouth swabs. The amount of DNA collected on the swab can also be a bottleneck for sequencing and it's good to see that this wasn't an issue here.
Using the information about known gene locations, we can also look where the reads actually map to:
Human gene sequences consist of introns and exons; the latter are translated into proteins that carry out most functions in the cell. For humans, these “exonic regions” amount to 1-2% of the genome. As you can see, 2% of the reads align to exonic regions, which is the amount we expect. The majority of reads however, align to either intronic or intergenic regions.
Where are the bacterial reads?
One of the reports provided is about the oral microbiome, so the types and abundances of bacteria that were present in your mouth at the time of testing. But how can they know that when they align it only to the human genome? Well, indeed it is not possible to estimate that from the alignments that you get. But. If you look again on our mapping statistics above, you see that 0.6% of the reads do not align with the human genome. And since we are really looking at a lot of data, these 0.6% amount to almost 5 million sequences that we can use for further analysis. Fortunately, Nebula Genomics chose to include the unmapped reads in the CRAM file, which makes it easy to extract them and conduct further microbial analysis of your own! We used the well-known taxonomic classification tool Kraken2 and indeed obtained results very similar to their oral microbiome report.
Coverage statistics
When it comes to the assessment of sequencing data quality, a key question is: how good is the obtained coverage? Coverage means (link article) how many read sequences “cover” each position in our genome, providing us with a sufficiently large sample size to confidently detect changes. Nebula Genomics promised a coverage of 30x. Let us check if they can fulfill this promise:
The average coverage for the complete genome is 36.1, exceeding the expected value by about 20%. Very nice. We also see that there is some variation between the chromosomes. The biggest outliers are chrX and chrY, which is expected as I have only one of each compared to two of the others… It is a bit unfortunate that the chrY coverage is only 11.9 because this information is valuable for ancestry analysis. I left out the mitochondrial genome (chrM), because with a coverage of 9,620 this is a massive outlier! This is also expected, as each cell contains hundreds to thousands of copies of mtDNA.
Let us consider that above numbers represent averages over all possible positions in the genome. In practice, the coverage is not uniform but rather looks like this:
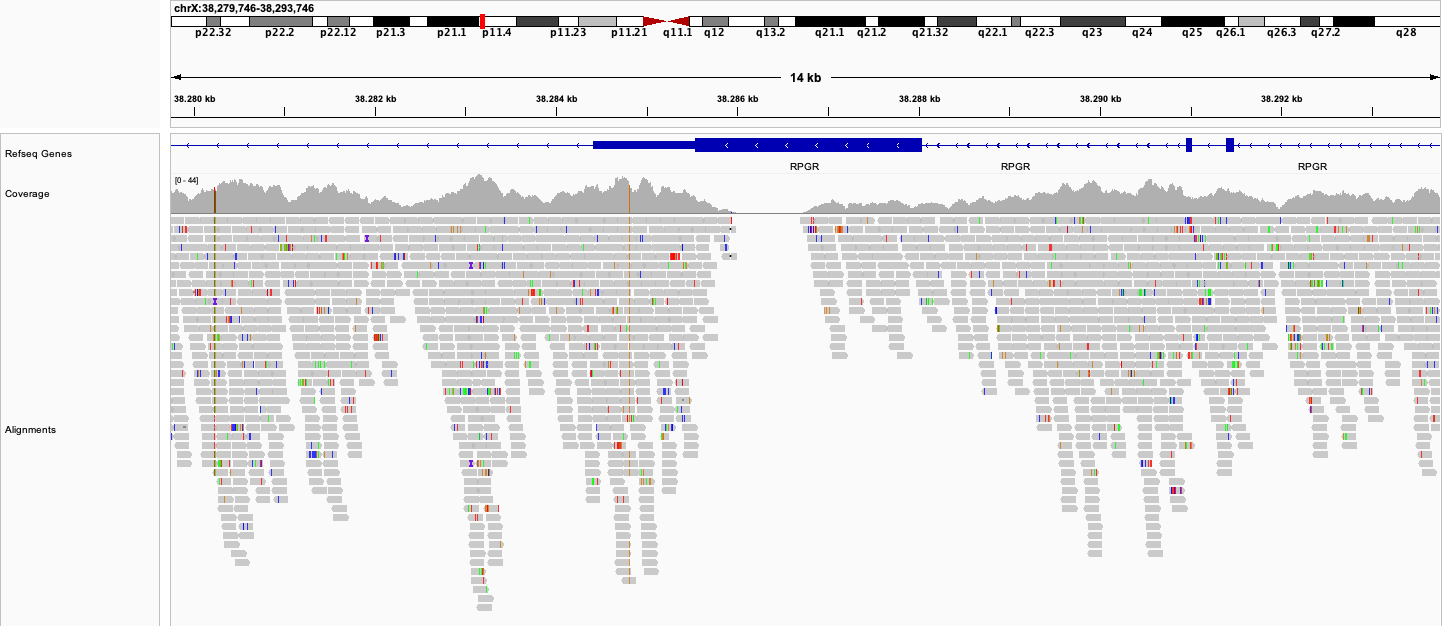
We see that there are coverage hills and valleys, and sometimes the coverage also goes down to 0. The reason is that certain regions of the genome differ in their amenability for sequencing according to their specific sequence content (see here). Unfortunately there is no real way to address this issue, other than by increasing the global level of sequencing depth to ensure that most regions still reach a minimum level of coverage. Ideally, we would like to get a coverage of 20x or more for all positions, because this allows us to confidently detect the germline variants for those positions. We can detect variants also at lower coverages, but with lower confidence. It is likely for this reason that Nebula Genomics offers a global coverage of 30x as a tradeoff.
When it comes to health-related information, often the most directly-relevant regions in the genome are those that eventually get made into proteins and can have a function in the cell. Naturally, it is interesting to look at how the coverage is in this high-priority region. So we did the analysis again, this time limiting ourselves to exonic regions, amounting to about 35 megabases (using a slightly modified set of RefSeq genes, similar to those used for Exome enrichments). Here is how the coverage looks like:
The mean coverage in this region is 32X, and 88% of positions have a coverage above 20x. Unfortunately, about 1 megabase (2.7% of those positions) have such a low coverage that it was not possible to detect variants at all. However, to put this in perspective, also in much more expensive clinical exome NGS kits between 1-2% of positions cannot be called. So this is something that must be expected and can only be resolved with more expensive techniques.
DNA Variants
The last file that we are offered to download contains the detected DNA variants in VCF format. For our sample, the total number was a sweeping 4.84 million variants. About 27k (or 0.6%) of these variants were located in exonic regions. This fraction is significantly less than the fraction of the exonic regions compared to the whole genome. This is entirely expected, since protein-coding exons have a more direct influence on biological processes, and are naturally more conserved due to natural selection. Note that many of the GWAS-related variants are actually outside of exonic regions because of the way these studies are performed.
To detect the variants, Nebula Genomics relied on the GATK HaplotypeCaller as part of the MGIs. HaplotypeCaller is the most widely-used tool for detecting DNA variants from NGS data, and it is completely open source. This is a good choice because it makes it easy to interpret the results and also increases the interoperability with other tools. The whole workflow includes steps for marking duplicates, recalibrating base quality scores and sorting the alignment files, all of which are key steps of a best practices workflow.
Duplication refers to the occurrence of the exact same sequence multiple times. Despite the huge amount of short-read data we are sequencing, the likelihood of such duplicates occurring naturally is in fact very low. High levels of duplication are therefore indicative of issues during sample preparation. Due to the biases introduced by duplicates, high levels can result in reduced confidence in the accuracy of variant calls. Consequently, they are typically excluded from variant detection. We independently assessed the duplication levels, and discovered that there were 24 million (3.2%) duplicate sequences in the data. This aligns with expectations based on other samples of good quality.
Thankfully the VCF already includes a DBsnp identifier. DBsnp is the largest database of human SNPs and having a pointer to the respective database entries simplifies working with the variants a lot. In our case, an identifier was available for about 97% of the detected variants.
Summary
With this we conclude our analysis of the WGS data you can get from consumer genetic testing company Nebula Genomics Inc. The sequencing data comes in sufficient quantities and also in very good quality. Together with the read length of 150 bp, which is good by current short-read sequencing standards, this means that most sequences can be aligned to the human genome, enabling the detection of a high number of DNA variants. Furthermore, Nebula Genomics deserves kudos for not only making available the most relevant files (including the complete raw sequences) but also for using standard tools (and consequently known standard contents) to generate these files. It would be possible to provide some additional QC metrics and analysis results (such as structural variations), and this is partly done by some competitors. However it is totally understandable for Nebula Genomics to not provide them, since in fact you need to be an expert to interpret those results properly - and an expert could also create them for yourself given sufficient computing resources. In summary, I am positively surprised about the great data you can get today for such a small cost. How much actionable advice and learnings you - as an consumer - are able to get from this data by today's knowledge, however, is a different story.